Line Chart - 7
Practice and master this topic with our carefully crafted questions.
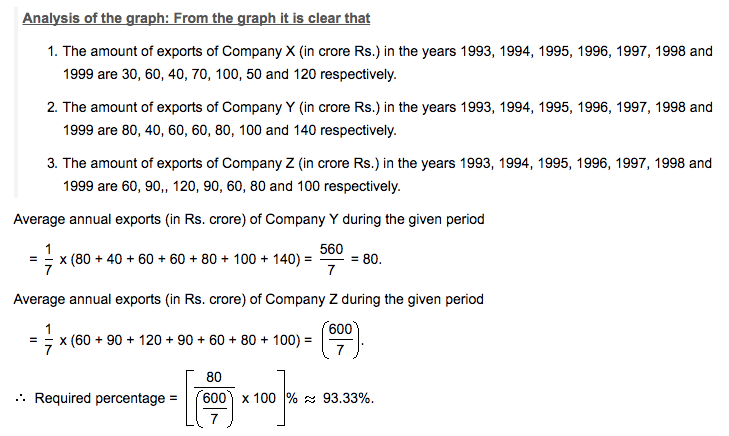
Study the following line graph and answer the questions.
Exports from Three Companies Over the Years (in Rs. crore)

Total exports of the three Companies X, Y and Z together, during various years are:
In 1993 = Rs. (30 + 80 + 60) crores = Rs. 170 crores.
In 1994 = Rs. (60 + 40 + 90) crores = Rs. 190 crores.
In 1995 = Rs. (40 + 60 + 120) crores = Rs. 220 crores.
In 1996 = Rs. (70 + 60 + 90) crores = Rs. 220 crores.
In 1997 = Rs. (100 + 80 + 60) crores = Rs. 240 crores.
In 1998 = Rs. (50 + 100 + 80) crores = Rs. 230 crores.
In 1999 = Rs. (120 + 140 + 100) crores = Rs. 360 crores.
Clearly, the total exports of the three Companies X, Y and Z together are same during the years 1995 and 1996.
The difference between the exports from the Companies X and Y during the various years are:
In 1993 = Rs. (80 - 30) crores = Rs. 50 crores.
In 1994 = Rs. (60 - 40) crores = Rs. 20 crores.
In 1995 = Rs. (60 - 40) crores = Rs. 20 crores.
In 1996 = Rs. (70 - 60) crores = Rs. 10 crores.
In 1997 = Rs. (100 - 80) crores = Rs. 20 crores.
In 1998 = Rs. (100 - 50) crores = Rs. 50 crores.
In 1999 = Rs. (140 - 120) crores = Rs. 20 crores.
Clearly, the difference is minimum in the year 1996.
Average annual exports of Company Z during the given period
| = | 1 | x (60 + 90 + 120 + 90 + 60 + 80 + 100) |
| 7 |
| = Rs. |  | 600 |  | crores |
| 7 |
= Rs. 85.71 crores.
From the analysis of graph the exports of Company Z are more than the average annual exports of Company Z (i.e., Rs. 85.71 crores) during the years 1994, 1995, 1996 and 1999, i.e., during 4 of the given years.
Average exports of the three Companies X, Y and Z in 1993
| = ₹ |  | 1 | x (30 + 80 + 60) | ![]](http://learnfrenzy.com/assets/images/data-interpretation/common/1-sym-cbracket-h1.gif) | crores = ₹ | | 170 | | crores. |
| 3 | 3 |
Average exports of the three Companies X, Y and Z in 1998
| = ₹ | | 1 | x (50 + 100 + 80) | | crores = ₹ | | 230 | | crores. |
| 3 | 3 |
| Difference |
| |||||||||||||
| ||||||||||||||
| = ₹ 20 crores. |