Line Chart - 5
Practice and master this topic with our carefully crafted questions.
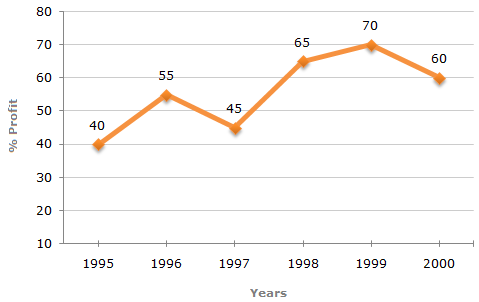
The following line graph gives the annual percent profit earned by a
Company during the period 1995 - 2000.
Percent Profit
Earned by a Company Over the Years.
|
%Profit = |
Income - Expenditure |
x 100 |
|
Expenditure |
Let the expenditure is 1998 be ₹ x crores.
| Then, 65 = | 264 - x | x 100 |
| x |
 | 65 | = | 264 | - 1 |
| 100 | x |
| x = | 264 x 100 | = 160. |
| 165 |
 Expenditure in 1998 = ₹ 160 crores.
Let the expenditure in 1996 = x.
Also, let the incomes in 1996 and 1999 be I1 and I2 respectively.
Then, for the year 1996, we have:
| 55 = | I1 - x | x 100 | | 55 | = | I1 | - 1 | |||
| x | 100 | x |
I1 = 155x / 100 -------- (i)| 70 = | I2 - x | x 100 | | 70 | = | I2 | - 1 | |||
| x | 100 | x |
I2 = 170X / 100 ----- (ii)
From (i) and (ii), we get:
| I1 | = |
| = | 155 |  | 0.91 | 9 : 10. | |||||
| I2 |
| 170 | 1 |


From the line-graph we obtain information about the percentage profit only. To find the profit in 2000 we must have the data for the income or expenditure in 2000.
Therefore, the profit for 2000 cannot be determined.
The line-graph gives the comparison of percent profit for different years but the comparison of the expenditures is not possible without more data.
Therefore, the year with minimum expenditure cannot be determined.
Average percent profit earned for the given years:
= 1/6 x [40 + 55 + 45 + 65 + 70 + 60]
= 335 / 6
= 55(5/6)