Line Chart - 3
Practice and master this topic with our carefully crafted questions.
The following line graph gives the percent profit earned by two Companies X and Y during the period 1996 - 2001.
Percentage profit earned by Two Companies X and Y over the Given Years
| %Profit = | Income - Expenditure | x 100 |
| Expenditure |
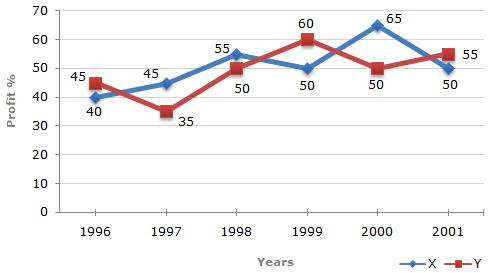
Profit percent of Company Y in 1997 = 35.
Let the income of Company Y in 1997 be ₹ x crores.
| Then, 35 = | x - 220 | x 100  x = 297. x = 297. |
| 220 |
 Income of Company Y in 1997 = ₹ 297 crores.
Let the incomes in 2000 of Companies X and Y be 3x and 4x respectively.
And let the expenditures in 2000 of Companies X and Y be E1 and E2 respectively.
Then, for Company X we have:
| 65 = | 3x - E1 | x 100 |
65 | = | 3x | - 1 | ||||
| E1 | 100 | E1 |
 E1 = 3x x (100/165) ...(i)
For Company Y we have:
| 50 = | 4x - E2 | x 100 |
50 | = | 4x | - 1 | ||||
| E2 | 100 | E2 |
E2 = 4x x (100/150) .... (ii)
From (i) and (ii), we get:
| E1 | = |
|
= | 3 x 150 | = | 15 | ||||||
| E2 |
|
4 x 165 | 22 |


(Required ratio).
Let the expenditures of each companies X and Y in 1996 be ₹ x crores.
And let the income of Company X in 1996 be ₹ z crores.
So that the income of Company Y in 1996 = ₹ (342 - z) crores.
Then, for Company X we have:
| 40 = | z - x | x 100 |
40 | = | z | - 1 | ||
| x | 100 | x |
x = (100z/140) ....(i)
Also, for Company Y we have:
45 = (342 - z) x 100 / x
| |
45 | = | (342 - z) | - 1 | ||||
| 100 | x |
x = (342 -z) x(100) /(145) ..... (ii)
From (i) and (ii), we get:
| 100z | = | (342 - z) x 100 | z = 168. |
| 140 | 145 |
Substituting z = 168 in (i), we get : x = 120.
Total expenditure of Companies X and Y in 1996 = 2x
= ₹ 240 crores.
Total income of Companies X and Y in 1996
= ₹ 342 crores.
Total profit = ₹ (342 - 240) crores = ₹ 102 crores.
Let the incomes of each of the two Companies X and Y in 1999 be Rs. x.
And let the expenditures of Companies X and Y in 1999 be E1 and E2 respectively.
Then, for Company X we have:
| 50 = | x - E1 | x 100 |
50 | = | x | - 1 | ||
| E1 | 100 | E1 |
x = 150E1 /100 .... (i)
Also, for Company Y we have:
| 60 = | x - E2 | x 100 |
60 | = | x | - 1 | ||
| E2 | 100 | E2 |
x = 160E2 / 100 ... (ii)
From (i) and (ii), we get:
| 150 | E1 = | 160 | E2 |
E1 | = | 160 | = | 16 | |
| 100 | 100 | E2 | 150 | 15 |
(Required ratio).
Let the income of Company X in 1998 be ₹ x crores.
| Then, 55 = | x - 200 | x 100 x = 310. |
| 200 |
| Expenditure of Company X in 2001 |
|
= Income of Company X in 1998
= ₹ 310 crores.
Let the income of Company X in 2001 be ₹z crores.
| Then, 50 = | z - 310 | x 100 z = 465. |
| 310 |
Income of Company X in 2001 = ₹ 465 crores.