Line Chart - 1
Practice and master this topic with our carefully crafted questions.
The following line graph gives the ratio of the amounts of imports by a company to the amount of exports from that company over the period from 1995 to 2001.
Ratio of Value of Imports to Exports by a Company Over the Years.
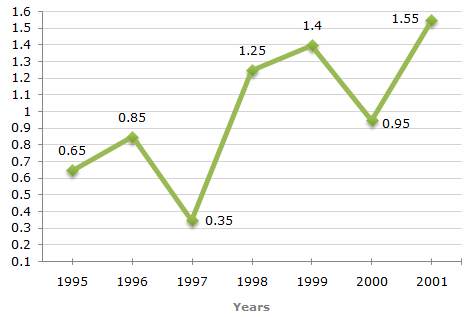
The exports are more than the imports imply that the ratio of value of imports to exports is less than 1.
Now, this ratio is less than 1 in years 1995, 1996, 1997 and 2000.
Thus, there are four such years.
Ratio of imports to exports in the year 1996 = 0.85.
Let the exports in 1996 = Rs. x crores.
| Then, | 272 | = 0.85  x = x = |
272 | = 320. |
| x | 0.85 |
 Exports in 1996 = Rs. 320 crores.
The graph gives only the ratio of imports to exports for different years. To find the percentage increase in imports from 1997 to 1998, we require more details such as the value of imports or exports during these years.
Hence, the data is inadequate to answer this question.
The ratio of imports to exports for the years 1998 and 1999 are 1.25 and 1.40 respectively.
Let the exports in the year 1998 = ₹ x crores.
Then, the exports in the year 1999 = ₹ (500 - x) crores.
| 1.25 = |
250 | x = |
250 | = 200 |
| x | 1.25 |
[Using ratio for 1998]
Thus, the exports in the year 1999 = ₹ (500 - 200) crores = ₹ 300 crores.
Let the imports in the year 1999 = ₹ y crores.
| Then, 1.40 = | y | y = (300 x 1.40) = 420. |
| 300 |
Imports in the year 1999 = ₹ 420 crores.
The imports are minimum proportionate to the exports implies that the ratio of the value of imports to exports has the minimum value.
Now, this ratio has a minimum value 0.35 in 1997, i.e., the imports are minimum proportionate to the exports in 1997.