Line Chart - 6
Practice and master this topic with our carefully crafted questions.
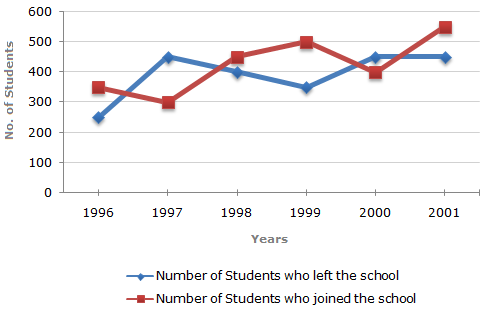
Study the following line graph which gives the number of students who joined and left the school in the beginning of year for six years, from 1996 to 2001.
Initial Strength of school in 1995 = 3000.
| Required ratio = | 300 | = | 2 | . |
| 450 | 3 |
As calculated above, the number of students studying in the school during 1999
= 3150
Before solving the questions, we shall analyse the graph :
From the graph it is clear that :
In 1996 : Number of students left = 250 and number of students joined = 350.
In 1997 : Number of students left = 450 and number of students joined = 300.
In 1998 : Number of students left = 400 and number of students joined = 450.
In 1999 : Number of students left = 350 and number of students joined = 500.
In 2000 : Number of students left = 450 and number of students joined = 400.
In 2001 : Number of students left = 450 and number of students joined = 550.
Therefore, the numbers of students studying in the school (i.e., strength of the school) in various years:
In 1995 = 3000 (given).
In 1996 = 3000 - 250 + 350 = 3100.
In 1997 = 3100 - 450 + 300 = 2950.
In 1998 = 2950 - 400 + 450 = 3000.
In 1999 = 3000 - 350 + 500 = 3150.
In 2000 = 3150 - 450 + 400 = 3100.
In 2001 = 3100 - 450 + 550 = 3200.
Percentage increase in the strength of the school from 1997 to 1998
| = |  | (3000 - 2950) | x 100 | ![]](http://learnfrenzy.com/assets/images/data-interpretation/common/1-sym-cbracket-h1.gif) | % = 1.69%  1.7%. 1.7%. |
| 2950 |
| Required percentage = |  | 3000 | x 100 |  | % |
| 3200 |
The percentage rise/fall in the number of students who left the school (compared to the previous year) during various years are:
| For 1997 = | | (450 - 250) | x 100 | | % = 80% (rise). |
| 250 |
| For 1998 = | | (450 - 400) | x 100 | | % = 11.11% (fall). |
| 450 |
| For 1999 = | | (400 - 350) | x 100 | | % = 12.5% (fall). |
| 400 |
| For 2000 = | | (450 - 350) | x 100 | | % = 28.57% (rise). |
| 350 |
| For 2001 = | | (450 - 450) | x 100 | | % = 0%. |
| 450 |
Clearly, the maximum percentage rise/fall is for 1997.