Line Chart - 2
Practice and master this topic with our carefully crafted questions.
Study the following line graph and answer the questions based on it.
Number of Vehicles Manufactured by Two companies ove the Years (Number in Thousands)
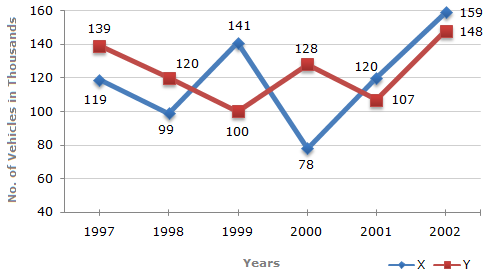
From the line-graph it is clear that the productions of Company X in the years 1997, 1998, 1999, 2000, 2001 and 2002 are 119000, 99000, 141000, 78000, 120000 and 159000 and those of Company Y are 139000, 120000,100000, 128000, 107000 and 148000 respectively.
Total production of Company X from 1997 to 2002
= 119000 + 99000 + 141000 + 78000 + 120000 + 159000
= 716000.
and total production of Company Y from 1997 to 2002
= 139000 + 120000 + 100000 + 128000 + 107000 + 148000
= 742000.
Difference = (742000 - 716000) = 26000.
Required difference = (128000 - 107000) = 21000.
Required percentage
| = |  |
128000 | x 100 |  |
%  164% 164% |
| 78000 |
The difference between the productions of Companies X and Y in various years are:
For 1997 (139000 - 119000) = 20000.
For 1998 (120000 - 99000) = 21000.
For 1999 (141000 - 100000) = 41000.
For 2000 (128000 - 78000) = 50000.
For 2001 (120000 - 107000) = 13000.
For 2002 (159000 - 148000) = 11000.
Clearly, maximum difference was in 2000.
Average number of Vehicles manufactured by company X
= 1/6 x (119000 + 99000 + 141000 + 78000 + 120000 + 159000)
= 119333