| 1. |
In which year is the expenditure minimum? |
|||||||||
Answer: Option D Explanation: The line-graph gives the comparison of percent profit for different years but the comparison of the expenditures is not possible without more data. Therefore, the year with minimum expenditure cannot be determined. |
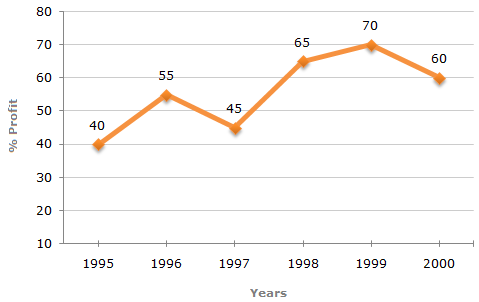
The following line graph gives the annual percent profit earned by a
Company during the period 1995 - 2000.
Percent Profit
Earned by a Company Over the Years.
|
%Profit = |
Income - Expenditure |
x 100 |
|
Expenditure |
Post your comments here:
Name *:
Email : (optional)
Your comments will be displayed only after manual approval.