Data Interpretation

Bar Chart 5

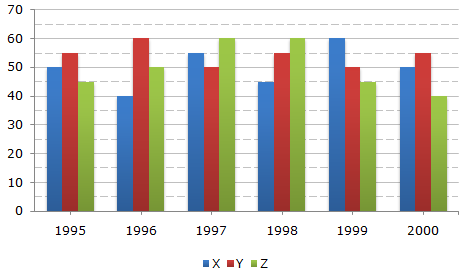
A soft drink company prepares drinks of three different flavours - X, Y and Z. The production of three flavours over a period of six years has been expressed in the bar graph provided below. Study the graph and answer the questions based on it.

Production of Three Different Flavours X, Y and Z by a Company over the years (in lakh bottles)


1.  For which of the following years the percentage of rise/fall in production from the previous year is the maximum for the flavour Y?

A. 1996
B. 1997
C. 1998
D. 1999
E. 2000
2.  For which flavour was the average annual production maximum in the given period?

A. X only
B. Y only
C. Z only
D. X and Y
E. X and Z
3.  What was the approximate decline in the production of flavour Z in 2000 as compared to the production in 1998?

A. 50%
B. 42%
C. 33%
D. 25%
E. 22.5%
4.  The total production of flavour Z in 1997 and 1998 is what percentage of the total production of flavour X in 1995 and 1996?

A. 96.67%
B. 102.25%
C. 115.57%
D. 120%
E. 133.33%
5.  What is the difference between the average production of flavour X in 1995, 1996 and 1997 and the average production of flavour Y in 1998, 1999 and 2000?

A. 50,000 bottles
B. 80,000 bottles
C. 2,40,000 bottles
D. 3,30,000 bottles
E. 5,00,000 bottles