Bar Chart 7
Practice and master this topic with our carefully crafted questions.
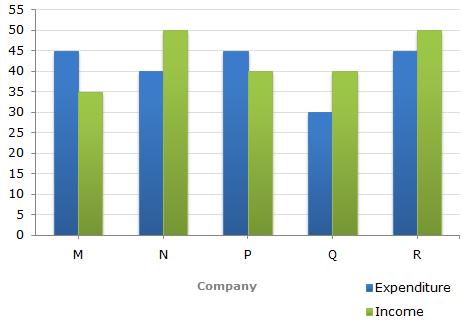
The following bar graph shows the Income and Expenditures (in million US
$) of five companies in the year 2001. The percent profit or loss of a company
is given by
|
% Profit/Loss = |
Income - Expenditure |
x 100 |
|
Expenditure |
Income and
Expenditure (in million US $) of five companies in the year 2001.
The percentage profit/loss in the year 2001 for various comapanies are:
| For M = |  | (35 - 45) | x 100 | ![]](http://learnfrenzy.com/assets/images/data-interpretation/common/1-sym-cbracket-h1.gif) | % = -22.22% |
| 45 |
| For N = | | (50 - 40) | x 100 | | % = 25% |
| 40 |
| For P = | | (40 - 45) | x 100 | | % = -11.11% |
| 45 |
| For Q = | | (40 - 30) | x 100 | | % = 33.33% |
| 30 |
| For R = | | (50 - 45) | x 100 | | % = 11.11% |
| 45 |
i.e., Profit = 11.11%.
Clearly, the Company Q earned the maximum profit in 2001.
Total income of all five companies
= (35 + 50 + 40 + 40 + 50) million US $
= 215 million US $.
Total expenditure of all five companies
= (45 + 40 + 45 + 30 + 45) million US $
= 205 million US $.
 % Profit = % Profit = | | (215 - 205) | x 100 | | % = 4.88%  5%. 5%. |
| 205 |
Let the income of Company Q in 2001 = x million US $.
| Then, income of Company in 2001 |
| ||||||||||||||||||||||
| i.e., income of Company Q in 2000 . |
| = |  | 400 |  | million US $. |
| 11 |
Let the expenditure of Company Q in 2000 be E million US $
| Then, 20 = | [(400/11) - E] | x 100 | |
| E |
 %Profit = 20% ]
 20 = 20 = | | | 400 | | - 1 | | x 100 |
| 11E |
| E = | 400 | x | 100 | = 30.30. |
| 11 | 120 |
Expenditure of Company Q in 2000 = 30.30 million US $.
Let the expenditure of Company R in 2000 be x million US $.
| Then, expenditure of Company R in 2001 |
| |||||||||||||
i.e., expenditure of Company R in 2000 = 37.5 million US $.
Let the income of Company R in 2000 be I million US $.
| Then, 10 = | (I - 37.5) | x 100 | |
| 37.5 |
[ %Profit in 2000 = 10%]
I - 37.5 = 3.75
I = 41.25
i.e., Income of Company R in 2000 = 41.25 million US $.
Total income of Companies M and N together
= (35 + 50) million US $
= 85 million US $
Total expenditure of Companies M and N together
= (45 + 40) million US $
= 85 million US $.
Percent Profit/Loss of companies M and N together
| % Profit/Loss = | | 85 - 85 | x 100 | | = 0%. |
| 85 |
Thus, there was neither loss nor profit for companies M and N together.