Bar Chart 1
Practice and master this topic with our carefully crafted questions.
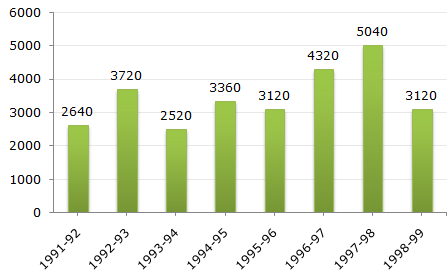
The bar graph given below shows the foreign exchange reserves of a country (in million US $) from 1991 - 1992 to 1998 - 1999.
Foreign Exchange Reserves Of a Country. (in million US $)
| Required ratio = | 5040 | = 1.5. |
| 3360 |
Average foreign exchange reserves over the given period = 3480 million US $.
The country had reserves above 3480 million US $ during the years 1992-93, 1996-97 and 1997-98, i.e., for 3 years and below 3480 million US $ during the years 1991-92, 1993-94, 1994-95, 1995-56 and 1998-99 i.e., for 5 years.
Hence, required ratio = 3 : 5.
= 3480 million US $.
Foreign exchange reserves in 1996 - 1997
= 4320 million US $.
 Required percentage = Required percentage = |  | 4320 | x 100 |  | % |
| 3480 |
 125%.
125%.Foreign exchange reserves in 1997 - 1998 = 5040 million US $.
Foreign exchange reserves in 1993 - 1994 = 2520 million US $.
Increase = (5040 - 2520) = 2520 US $.
| Percentage Increase = | | 2520 | x 100 | | % = 100%. |
| 2520 |
There is an increase in foreign exchange reserves during the years 1992 - 1993, 1994 - 1995, 1996 - 1997, 1997 - 1998 as compared to previous year (as shown by bar-graph).
The percentage increase in reserves during these years compared to previous year are:
| For 1992 - 1993 = |  | (3720 - 2640) | x 100 | ![]](http://learnfrenzy.com/assets/images/data-interpretation/common/1-sym-cbracket-h1.gif) | % = 40.91%. |
| 2640 |
| For 1994 - 1995 = | | (3360 - 2520) | x 100 | | % = 33.33%. |
| 2520 |
| For 1996 - 1997 = | | (4320 - 3120) | x 100 | | % = 38.46%. |
| 3120 |
| For 1997 - 1998 = | | (5040 - 4320) | x 100 | | % = 16.67%. |
| 4320 |
Clearly, the percentage increase over previous year is highest for 1992 - 1993