Bar Chart 3
Practice and master this topic with our carefully crafted questions.
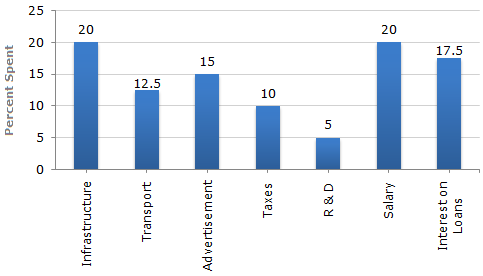
The bar graph given below shows the percentage distribution of the total expenditures of a company under various expense heads during 2003.
Percentage Distribution of Total Expenditure of a Company
Let the total amount of expenditures be Rs. x.
| Then, the expenditure on interest on loans = |
Rs. (17.5% of x) = Rs.
 17.5x /100
|
 Difference between the two expenditures Difference between the two expenditures
| |||||||||||||||||||||||||||||
| and so, the required percentage |
| = | | 5x/100 | x 100 | | % = 40%. |
| 12.5x/100 |
Let the total amount of expenditures be Rs. x.
Then, the total expenditure on infrastruture and transport
= Rs. [(20 + 12.5)% of x]
= Rs. [32.5% of x]
| = Rs. | | 32.5x | |
| 100 |
and total expenditure on taxes and interest on loans
= Rs. [(10 + 17.5)% of x]
= Rs. [27.5% of x]
| = Rs. | | 27.5x | |
| 100 |
| Required ratio = | | 32.5x/100 | | = | 13 | . |
| 27.5x/100 | 11 |
Let the total expenditure be Rs. x crores.
Then, 15% of x = 2.10
|
Total expenditure = Rs. 14 crores
and so, the difference between the expenditures on transport and taxes
= Rs. [(12.5 - 10)% of 14] crores
= Rs. [2.5% of 14] crores
= Rs. 0.35 crores
= Rs. 35 lakhs
Let the total expenditures be Rs. x.
Then, the expenditure on Research and Development (R & D)
= Rs. (5% of x)
| = Rs. | | 5 | x x | |
| 100 |
| = Rs. | | x | | . |
| 20 |
Ratio of the total expenditure to the expenditure on R & D
| = | | x | |
| x/20 |
| = | | 20 | | . |
| 1 |
Then, the total expenditure is 20 times the expenditure of Research and Development.
Let the total expenditure be Rs. x crores.
Then, 17.5% of x = 2.45  x = 14.
Total expenditure = Rs. 14 crores.
and so, the total expenditure on advertisement, taxes and Research and Development
= Rs. [(15 + 10 + 5)% of 14] crores
= Rs. [30% of 14] crores
= Rs. 4.2 crores.