Quantitative Aptitude
Exercise Mode
Bar Chart 5
Practice and master this topic with our carefully crafted questions.
5
Questions
8
Minutes
0%
Completed
Directions to Solve
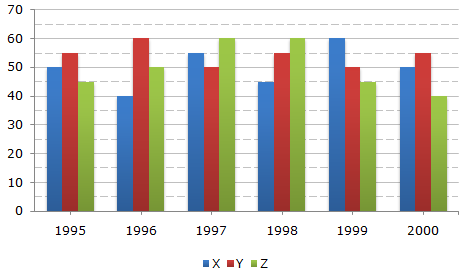
A soft drink company prepares drinks of three different flavours - X, Y and Z. The production of three flavours over a period of six years has been expressed in the bar graph provided below. Study the graph and answer the questions based on it.
Production of Three Different Flavours X, Y and Z by a Company over the years (in lakh bottles)
Question 1
For which of the following years the percentage of rise/fall in production from the previous year is the maximum for the flavour Y?
Correct Answer: Option B
The percentage rise/fall in production from the previous year for flavour Y during various years are:
| In 1996 = |  | (60 - 55) | x 100 | ![]](http://learnfrenzy.com/assets/images/data-interpretation/common/1-sym-cbracket-h1.gif) | % = 9.09% (increase) |
| 55 |
| In 1997 = | | (60 - 50) | x 100 | | % = 16.67% (decrease) |
| 60 |
| In 1998 = | | (55 - 50) | x 100 | | % = 10% (increase) |
| 55 |
| In 1999 = | | (55 - 50) | x 100 | | % = 9.09% (decrease) |
| 55 |
| In 2000 = | | (55 - 50) | x 100 | | % = 10% (increase) |
| 50 |
 Maximum change is decrease of 16.67% during 1997.
Question 2
For which flavour was the average annual production maximum in the given period?
Correct Answer: Option B
Average annual productions over the given period for various flavours are:
| For Flavour X = | | 1 | x (50 + 40 + 55 + 45 + 60 + 50) | | |
| 6 |
| For Flavour Y = | | 1 | x (55 + 60 + 50 + 55 + 50 + 55) | | |
| 6 |
| For Flavour Z = | | 1 | x (45 + 50 + 60 + 60 + 45 + 40) | | |
| 6 |
= 50 lakh bottles.
Maximum average production is for Flavour Y.
Question 3
What was the approximate decline in the production of flavour Z in 2000 as compared to the production in 1998?
Correct Answer: Option C
Percentage decline in the production of flavour Z in 2000 as compared to the production in 1998
| = | | (60 - 40) | x 100 | | % |
| 60 |
| = |  | 20 | x 100 |  | % |
| 60 |
= 33.33%
 33%.
33%.
Question 4
The total production of flavour Z in 1997 and 1998 is what percentage of the total production of flavour X in 1995 and 1996?
Correct Answer: Option E
| Required percentage |
| |||||||
| ||||||||
| = 133.33%. |
Question 5
What is the difference between the average production of flavour X in 1995, 1996 and 1997 and the average production of flavour Y in 1998, 1999 and 2000?
Correct Answer: Option E
Average production of flavour X in 1995, 1996 and 1997
| = | | 1 | x (50 + 40 + 55) | |
| 3 |
| = | | 145 | | lakh bottles. |
| 3 |
Average production of flavour Y in 1998, 1999 and 2000
| = | | 1 | x (55 + 50 + 55) | |
| 3 |
| = | | 160 | | lakh bottles. |
| 3 |
| Difference |
| ||||||||
| |||||||||
| = 5 lakh bottles | |||||||||
| = 5,00,000 bottles. |