| 1. |
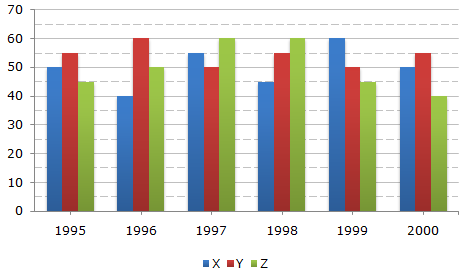
For which of the following years the percentage of rise/fall in production from the previous year is the maximum for the flavour Y? |
||||||||||||||||||||||||||||||||||||||||||||
Answer: Option B Explanation: The percentage rise/fall in production from the previous year for flavour Y during various years are:
|
A soft drink company prepares drinks of three different flavours - X, Y and Z. The production of three flavours over a period of six years has been expressed in the bar graph provided below. Study the graph and answer the questions based on it.
Production of Three Different Flavours X, Y and Z by a Company over the years (in lakh bottles)

![]](http://learnfrenzy.com/assets/images/data-interpretation/common/1-sym-cbracket-h1.gif)
 Maximum change is decrease of 16.67% during 1997.
Post your comments here:
Name *:
Email : (optional)
Your comments will be displayed only after manual approval.