Pie Chart 7
Practice and master this topic with our carefully crafted questions.
The pie chart shows the distribution of New York market share by value of different computer companies in 2016.

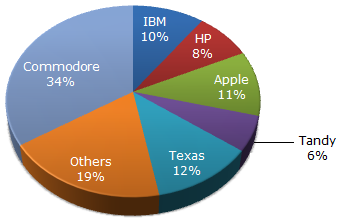
The pie chart shows the distribution of New York market share by volume of different computer companies in 2016.
Number of units sold in 2016 in New York = 1,500
Value of units sold in 2016 in New York = US $1,650,000.
IBM accounts for 28% of the share by value and 10% of the share by volume.
28% of 1650000 = 28 x 1650000/100 = 462000
10% of 1500 = 10 x 1500/100 = 150
Therefore, average unit sale price = 462000/150 = 3080.
Although it seems to be Commodore, the answer cannot be determined due to the fact that we are unaware of the break-up of the sales value and volume of companies compromising the other categories.
If we assume the total sales to be 100 in the first year, IBM's sales would go up by 50% (from 28 to 42) contributing an increase of 14 to the total sales value.
Similarly, Apple's increase of 15% would contribute an increase of 2.1 to the total sales value. The net change would be 14 + 2.1 on 100. (i.e., 16.1%)