Quantitative Aptitude
Exercise Mode
Pie Chart 6
Practice and master this topic with our carefully crafted questions.
5
Questions
8
Minutes
0%
Completed
Directions to Solve
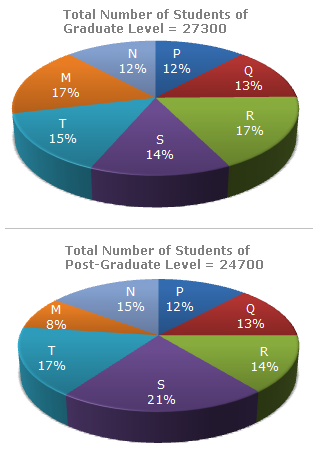
The following pie-charts show the distribution of students of graduate and post-graduate levels in seven different institutes - M, N, P, Q, R, S and T in a town.
Distribution of students at graduate and post-graduate levels in seven institutes- M, N, P, Q, R, S, and T
Question 1
How many students of institutes M and S are studying at graduate level ?
Correct Answer: Option B
Students of institute M at graduate level : Total number of students at graduate in institute M and S
= 17% of 27300 = 4641
Students of institute S at graduate level :
= 14% of 27300 = 3822
Total number of students at graduate in institute M and S= (4641 + 3822) = 8463
Question 2
What is the total number of graduate and post-graduate level students in institute R ?
Correct Answer: Option D
Required number
= (17% of 27300) + (14% of 24700)
= 4641 + 3458
= 8099.
Question 3
Total number of students studying at post-graduate level from institutes N and P is :
Correct Answer: Option C
Required number:
= (15% of 24700) + (12% of 24700)
= 3705 + 2964
= 6669
Question 4
What is the ratio between the number of students studying at post-graduate level from institutes S and the number of students studying at graduate level from institute Q ?
Correct Answer: Option D
Required ratio =
(21% of 24700) | = | (21 x 24700) | = | 19 | . |
| (13% of 27300) | 13 x 27300 | 13 |
Question 5
What is the ratio between the number of students studying at post-graduate and graduate levels respectively from institute S ?
Correct Answer: Option D
Required ratio =
| (21% of 24700) | = | (21 x 24700) | = | 19 | . | |
| (14% of 27300) | 14 x 27300 | 14 |