Pie Chart 4
Practice and master this topic with our carefully crafted questions.
Study the
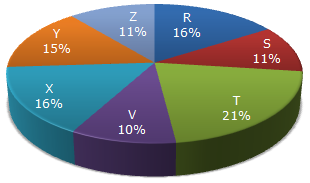
following pie-chart and the table and answer the questions based on them.
Proportion of Population of Seven Villages in 1997
|
Village |
% Population Below Poverty Line |
|
X |
38 |
|
Y |
52 |
|
Z |
42 |
|
R |
51 |
|
S |
49 |
|
T |
46 |
|
V |
58 |
Let the population of village X be x.
Then, 38% of x = 12160  x = x = | 12160 x 100 | |
| 38 |
Now, if s be the population of village S, then
| 16 : 11 = 32000 : s s = |  | 11 x 3200 |  | = 22000. |
| 16 |
Let N be the total population of all the seven villages.
Then, population of village T below poverty line
= 46% of (21% of N)
and Population of villages Z below the poverty line
= 42% of (11% of N)
 Required ratio = Required ratio = | 46% of (21% of N) | = | 46 x 21 | |
| 42% of (11 % of N) | 42 x 11 |
Population of village R = 32000 (given).
Let the population of village Y be y.
| Then, 16 : 15 = 32000 : y y = | | 15 x 32000 | | |
| 16 |
= 30000.
Population of village Y below poverty line
= 52% of 30000 = 15600
Population of village Y in 1997 = 30000 (given).
Let the population of village V in 1997 be v.
| Then, 15 : 10 = 30000 : v v = | 30000 x 10 | |
| 15 |
= 20000.
Now, population of village V in 1998
= 20000 + (10% of 20000) = 22000.
Population of village V below poverty line in 1998
= 58% of 22000 = 12760.
Population of village R in 1999 1760N/10000 1045N/10000 = 51% of 1760N/10000 / 42% of 1045N/10000