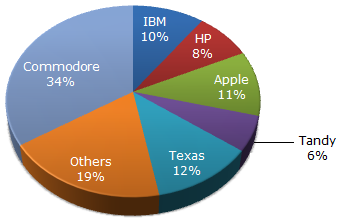
The pie chart shows the distribution of New York market share by value of different computer companies in 2016.

The pie chart shows the distribution of New York market share by volume of different computer companies in 2016.
Number of units sold in 2016 in New York = 1,500
Value of units sold in 2016 in New York = US $1,650,000.
| 3. |
Over the period 2016-2017, if sales (value wise) of IBM PC's increased by 50% and Apple by 15% assuming that PC sales of all other computer companies remained same, by what percentage (approximately) would the PC sales in New York (value wise) increase over the same period ? |
|||||||
|
Page 1of 1
1