The following pie-charts show the distribution of students of graduate and post-graduate levels in seven different institutes - M, N, P, Q, R, S and T in a town.
Distribution of students at graduate and post-graduate levels in seven institutes- M, N, P, Q, R, S, and T
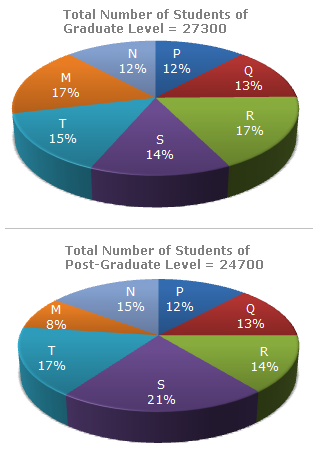
 Total number of students at graduate in institute M and S
Page 1of 1
1