Study the
following pie-chart and the table and answer the questions based on them.
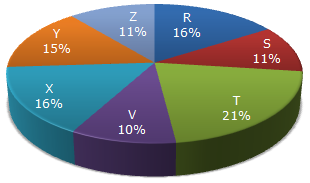
Proportion of Population of Seven Villages in 1997
|
Village |
% Population Below Poverty Line |
|
X |
38 |
|
Y |
52 |
|
Z |
42 |
|
R |
51 |
|
S |
49 |
|
T |
46 |
|
V |
58 |
 x =
x =

 Required ratio =
| 4. |
If in 1998, the population of village Y and V increase by 10% each and the percentage of population below poverty line remains unchanged for all the villages, then find the population of village V below poverty line in 1998, given that the population of village Y in 1997 was 30000. |
|||||||
|
| 5. |
If in 1999, the population of village R increase by 10% while that of village Z reduces by 5% compared to that in 1997 and the percentage of population below poverty line remains unchanged for all the villages, then find the approximate ratio of population of village R below poverty line to the ratio of population of village Z below poverty line for the year 1999. |
|||||||
|
Page 1of 1
1