Data Interpretation

Pie Chart 3

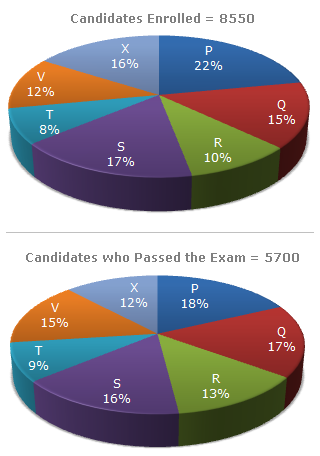
Study the following graph carefully and answer the questions given below:

Distribution of candidates who were enrolled for MBA entrance exam and the candidates (out of those enrolled) who passed the exam in different institutes:


1.  What percentage of candidates passed the Exam from institute T out of the total number of candidates enrolled from the same institute ?

A. 50%
B. 62.5%
C. 75%
D. 80%
2.  What is the ratio of candidates passed to the candidates enrolled from institute P ?

A. 9 : 11
B. 14 : 17
C. 6 : 11
D. 9 : 17
3.  Which institute has the highest percentage of candidates passed to the candidates enrolled ?

A. Q
B. R
C. V
D. T
4.  What is the percentage of candidates passed to the candidates enrolled for institutes Q and R together ?

A. 68%
B. 80%
C. 74%
D. 65%
5.  The number of candidates passed from institute S and P together exceeds the number of candidates enrolled from institute T and R together by :

A. 228
B. 279
C. 399
D. 407