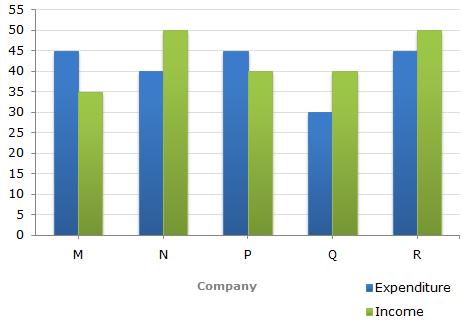
The following bar graph shows the Income and Expenditures (in million US
$) of five companies in the year 2001. The percent profit or loss of a company
is given by
|
% Profit/Loss = |
Income - Expenditure |
x 100 |
|
Expenditure |
Income and
Expenditure (in million US $) of five companies in the year 2001.

![]](http://learnfrenzy.com/assets/images/data-interpretation/common/1-sym-cbracket-h1.gif)
 % Profit =
 5%.
5%.

 x =
x =
Page 1of 1
1