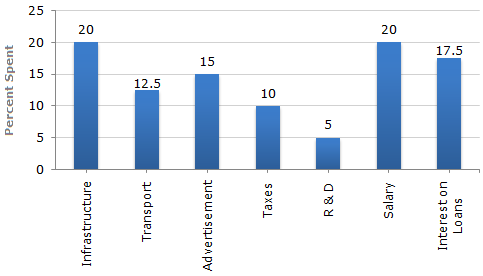
The bar graph given below shows the percentage distribution of the total expenditures of a company under various expense heads during 2003.
Percentage Distribution of Total Expenditure of a Company
Post your comments here:
Name *:
Email : (optional)
Your comments will be displayed only after manual approval.