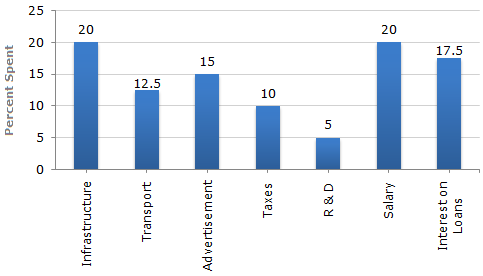
The bar graph given below shows the percentage distribution of the total expenditures of a company under various expense heads during 2003.
Percentage Distribution of Total Expenditure of a Company
 17.5x /100
 Difference between the two expenditures
 x =
x =
Page 1of 1
1