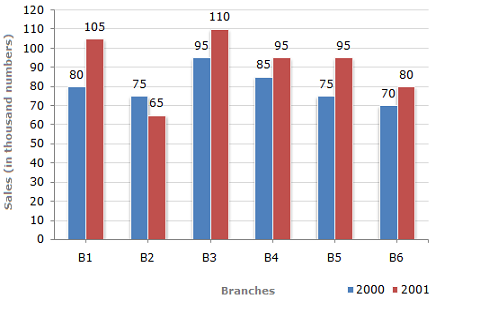
The bar graph given below shows the sales of books (in thousand number) from six branches of a publishing company during two consecutive years 2000 and 2001.
Sales of Books (in thousand numbers) from Six Branches - B1, B2, B3, B4, B5 and B6 of a publishing Company in 2000 and 2001.

![]](http://learnfrenzy.com/assets/images/data-interpretation/common/1-sym-cbracket-h1.gif)


 Required percentage =
Page 1of 1
1