Data Interpretation

Table Chart 1

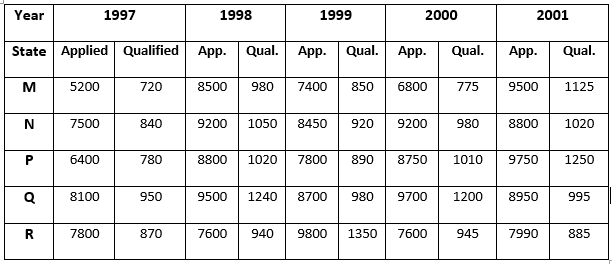
Study the following table and answer the questions.

Number of Candidates Appeared and Qualified in a Competitive Examination from Different States Over the Years.


1.  Combining the states P and Q together in 1998, what is the percentage of the candidates qualified to that of the candidate appeared?

A. 10.87%
B. 11.49%
C. 12.35%
D. 12.54%
E. 13.05%
2.  What is the percentage of candidates qualified from State N for all the years together, over the candidates appeared from State N during all the years together?

A. 12.36%
B. 12.16%
C. 11.47%
D. 11.15%
E. None of these
3.  In which of the given years the number of candidates appeared from State P has maximum percentage of qualified candidates?

A. 1997
B. 1998
C. 1999
D. 2001
E. 2000
4.  What is the average candidates who appeared from State Q during the given years?

A. 8700
B. 8760
C. 8990
D. 8920
E. 8810
5.  The percentage of total number of qualified candidates to the total number of appeared candidates among all the five states in 1999 is?

A. 11.49%
B. 11.84%
C. 12.21%
D. 12.57%
E. 12.73%
6.  Total number of candidates qualified from all the states together in 1997 is approximately what percentage of the total number of candidates qualified from all the states together in 1998?

A. 72%
B. 77%
C. 80%
D. 83%
E. 86%